
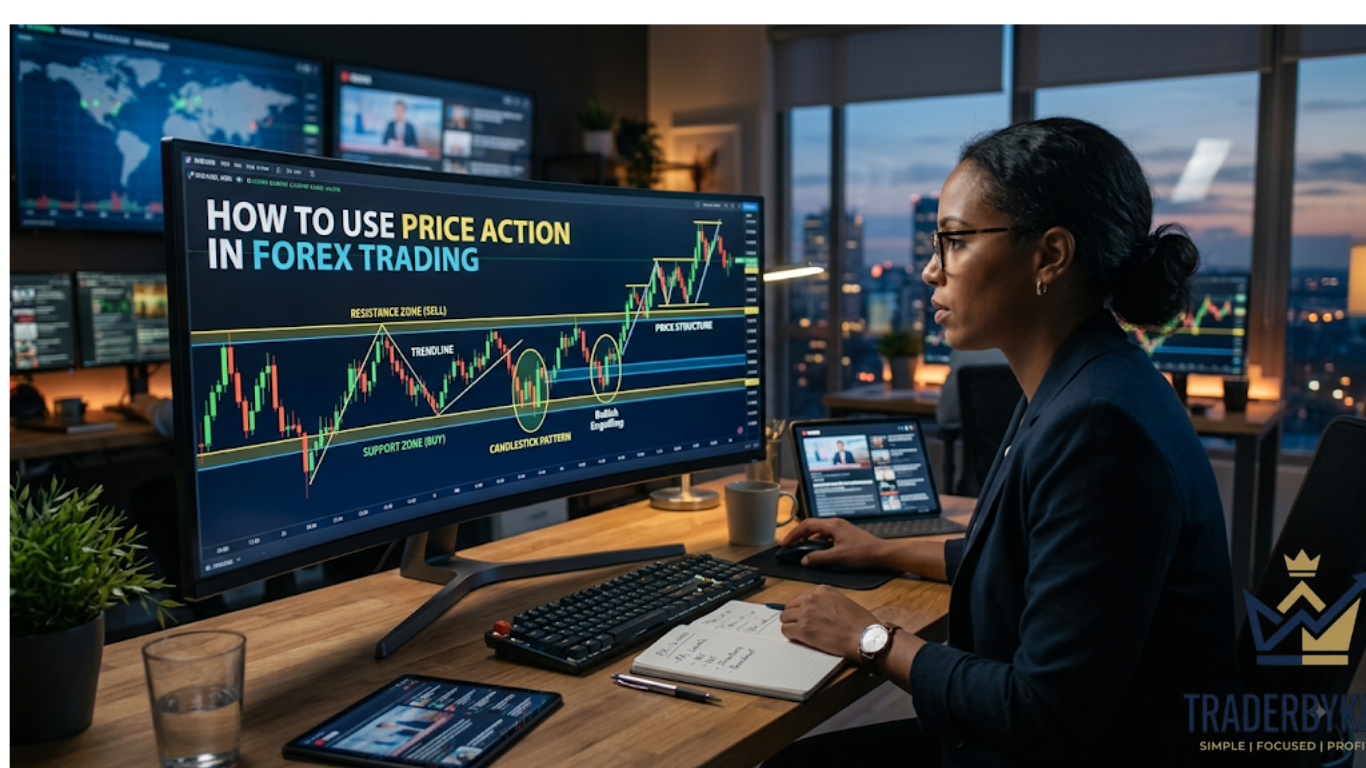
How to Use Price Action in Forex Trading: A Beginner’s Masterclass
Unlocking real profitability in the currency market comes down to reading raw market movement without lagging indicators. Learning how to use price action in Forex trading gives you a clear, unfiltered view of buyer and seller behavior across every timeframe.
The Forex market generates over $7 trillion in daily volume, creating distinct chart patterns and supply-demand zones. Relying on overcrowded indicators often causes delayed entries and missed moves.
By mastering clean chart analysis, you gain the confidence to spot high-probability setups early, control your trading risk, and build a sustainable trading strategy.
The Core Concept: Decoding Raw Price Action Mechanics
Price action trading relies on analyzing price movement as it happens on a clean chart. Instead of cluttering your screen with moving averages or oscillators, you study raw Japanese candlestick patterns, support and resistance zones, and market structure.
Every single candlestick tells a dynamic story about market sentiment. The wick shows rejection, the body represents conviction, and the close reveals who won the battle between bulls and bears.
Understanding this foundation rests on three vital pillars:
- Market Structure: Identifying market phases like higher highs in uptrends or lower lows in downtrends.
- Key Horizontal Levels: Finding historic price points where strong buying or selling previously occurred.
- Candlestick Rejections: Spotting long wicks at key zones that signal impending trend reversals.
Mastering these basics lets you read chart momentum instantly without second-guessing your analysis.
Key Highlights: Essential Price Action Patterns You Must Master
Recognizing reliable candlestick signals allows you to enter trades with precision. Here are the most effective price action setups used by professional traders worldwide.
+-----------------------------------------------------------------------+
|                    PRICE ACTION ENTRY CHECKLIST                       |
+-----------------------------------------------------------------------+
|  Step 1: Identify Overall Trend (Daily / 4-Hour Timeframe)            |
|  Step 2: Mark Major Support or Resistance Zones                       |
|  Step 3: Wait for a Trigger Pattern (Pinbar / Engulfing Candle)       |
|  Step 4: Execute with Minimum 1:2 Risk-to-Reward Ratio                |
+-----------------------------------------------------------------------+
1. The Pin Bar Reversal Pattern
A Pin Bar features a small body and a long tail extending outward. A rejection wick bouncing off a key support zone indicates that sellers pushed hard, but buyers completely took over before the candle closed.
2. The Bullish & Bearish Engulfing Pattern
An engulfing pattern consists of two candles. The second candle completely swallows the body of the previous candle, signaling a powerful shift in momentum and a strong continuation setup.
3. Inside Bar Breakout Setup
An inside bar stays entirely within the high and low range of the preceding “mother bar.” It reflects market consolidation before an explosive breakout occurs.
Practical Execution: Setting High-Probability Trade Entries
Knowing how to use price action in Forex trading effectively requires combining candlestick patterns with key horizontal levels. Never trade a pattern in isolation; always demand location confluence.
When a Pin Bar forms directly at a major support level in an ongoing uptrend, your probability of success jumps dramatically. Set your stop-loss just past the candlestick wick and aim for at least double your risk.
Looking for real-time market breakdowns, daily setups, and step-by-step chart analysis? Join our Telegram channel for daily updates
and trade alongside professional market analysts!
Comparing Price Action Patterns and Market Performance
Different price action setups excel in specific market conditions. Matching the right pattern to the right environment drastically improves win rates.
| Price Action Pattern | Market Environment | Confirmation Signal | Best Timeframes | Risk Profile |
| Pin Bar Reversal | Trending or Ranging | Long Wick Rejection | 1H, 4H, Daily | Low |
| Engulfing Pattern | Trend Continuation | Full Body Coverage | 15M, 1H, 4H | Medium |
| Inside Bar | Pre-Breakout / Squeeze | Range Break & Close | 4H, Daily | Medium |
| Double Top / Bottom | Major Reversals | Neckline Breakdown | 1H, 4H, Daily | Low to Medium |
Takeaways & Next Steps for Price Action Success
Mastering how to use price action in Forex trading transforms the way you view chart behavior. Stripping away unnecessary indicators brings clarity, eliminates analysis paralysis, and keeps you aligned with institutional money flow.
Start by loading a clean chart and marking daily support and resistance levels. Practice identifying Pin Bars and Engulfing patterns on a demo account until reading price momentum becomes second nature.
Want live chart setups, real-time alerts, and proven price action strategies delivered daily? Get instant alerts on Telegram
and join our active community of Forex traders today!
Frequently Asked Questions (FAQs)
Is price action trading better than using technical indicators?
Price action trading eliminates time lag because you react directly to current price movement. While indicators calculate past data, price action reflects real-time buying and selling pressure.
Which timeframe works best for price action in Forex?
Higher timeframes like the 4-hour and daily charts offer the clearest price action signals with minimal market noise. Lower timeframes work well for intraday execution once higher timeframe direction is set.
Can absolute beginners learn price action trading easily?
Yes. Price action trading simplifies technical analysis by focusing entirely on candlestick patterns, support, resistance, and market trends without confusing indicator overlays.
Do I need special charting software for price action analysis?
No special tools are required. Any standard charting platform with clean Japanese candlestick charts provides everything you need to map support, resistance, and price patterns.